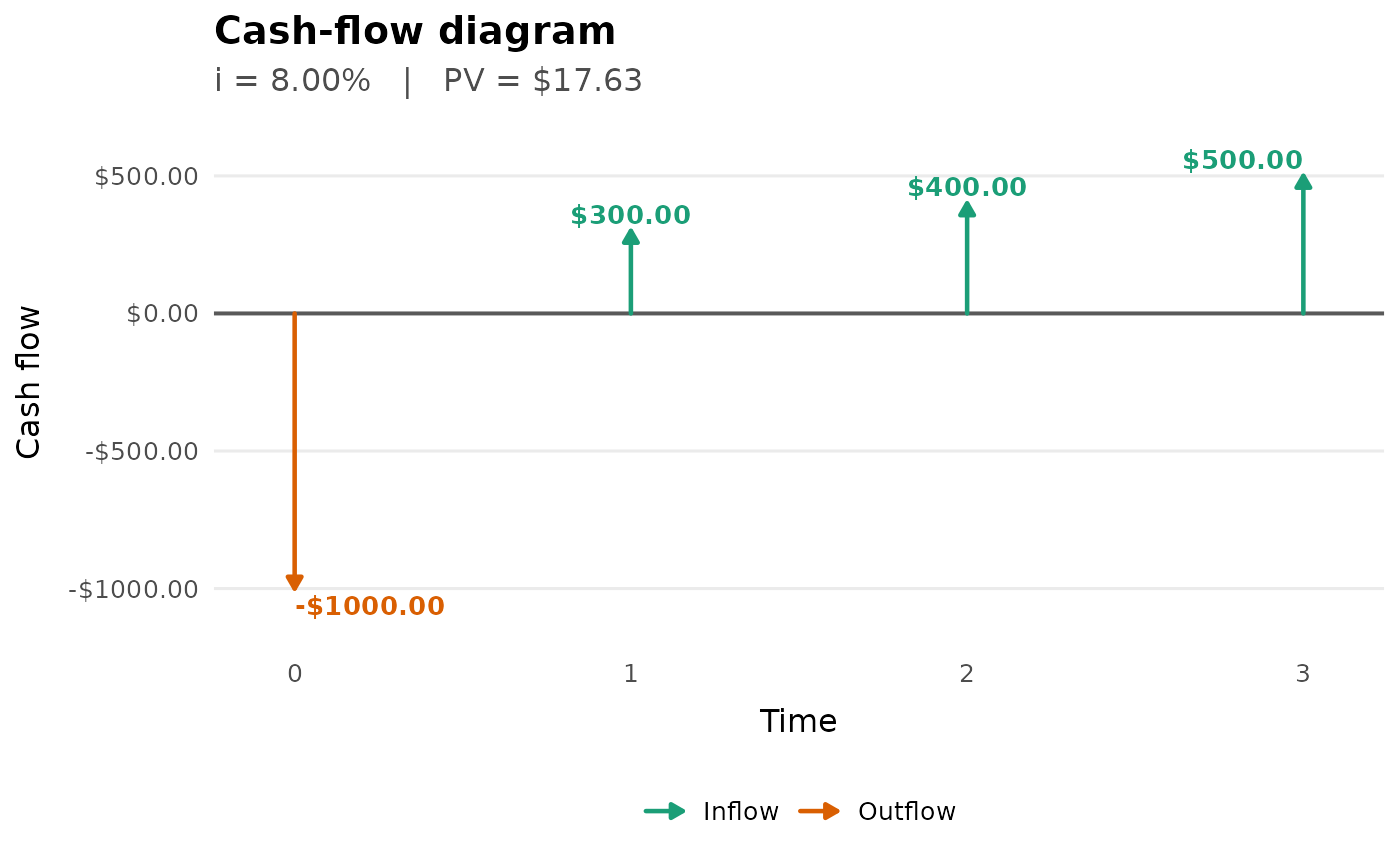
Creates a professional cash-flow diagram with arrows representing inflows and outflows over time, using compact actuarial notation.
Usage
plot_cash_flow(
  .data = NULL,
  C,
  t = NULL,
  date = NULL,
  i = NULL,
  i_type = "effective",
  m = 1L,
  PV = NULL,
  payment = NULL,
  time = NULL,
  rate = NULL,
  pv = NULL,
  title = NULL,
  subtitle = NULL,
  x_label = NULL,
  amount_label = "Cash flow",
  financial = TRUE,
  normalize = FALSE,
  aggregate = TRUE,
  show_labels = TRUE,
  label_size = 3.5,
  arrow_size = 0.8,
  timeline_size = 0.7,
  label_digits = 2L,
  label_format = c("auto", "full", "compact"),
  currency = "",
  col_inflow = "#1B9E77",
  col_outflow = "#D95F02",
  date_labels = "%Y-%m-%d",
  day_count = c("act/365", "act/360"),
  ...
)
Arguments
- .data
Optional data.frame or tibble containing cash-flow columns.
- C
Numeric vector of cash flows, or a column name when
.datais supplied.- t
Optional numeric vector of times in years, or a column name when
.datais supplied.- date
Optional date vector, or a column name when
.datais supplied.- i
Optional annual interest-rate input used to compute present value if
PVisNULL.- i_type
Character string indicating the interest-rate type.
- m
Positive integer. Conversion frequency for nominal rates.
- PV
Optional numeric present value to display.
- payment
Deprecated. Use
C.- time
Deprecated. Use
t. Kept explicit to avoid partial matching withtimeline_size.- rate
Deprecated. Use
i.- pv
Deprecated. Use
PV.- title
Optional plot title.
- subtitle
Optional plot subtitle.
- x_label
Optional x-axis label.
- amount_label
Optional y-axis label when
normalize = FALSE.- financial
Logical. If
TRUE, positive cash flows point upward and negative cash flows point downward.- normalize
Logical. If
TRUE, arrow heights are normalized.- aggregate
Logical. If
TRUE, cash flows occurring at the same time or date are summed before plotting.- show_labels
Logical. If
TRUE, labels are shown next to cash-flow arrows.- label_size
Numeric text size for labels.
- arrow_size
Numeric line width for arrows.
- timeline_size
Numeric line width for the time axis.
- label_digits
Integer between 0 and 50: decimal digits for cash-flow labels.
- label_format
Character string controlling label notation. Use
"auto"to abbreviate values from one million onward,"full"for unabridged values, or"compact"for abbreviated values such as1.25M.- currency
Optional currency or unit prefix, such as
$.- col_inflow
Character color for inflow arrows.
- col_outflow
Character color for outflow arrows.
- date_labels
Character date-label format passed to
ggplot2::scale_x_date().- day_count
Day-count convention used when
dateis supplied.- ...
Reserved for future extensions.
Details
Present values use the original interest specification and combine capital
and discount factors stably. Opposite amounts with exactly equal finite
log factors are netted if individual present values overflow.
Numeric timelines may include negative times; the valuation origin remains
zero. Dated timelines use the earliest date
as origin. Non-finite inferred present values or aggregated amounts are
rejected. Extreme monetary magnitudes use scaled graphical coordinates,
with the power of ten stated on the axis; raw amounts remain in plot$data$C.
Automatic/compact labels use scientific notation beyond the available
suffixes or when fixed decimals would show a nonzero amount as zero.
label_format = "full" retains explicit fixed-decimal formatting.
Overlapping text labels may be omitted at rendering time; every arrow
remains. For dense streams, use show_labels = FALSE. Simultaneous flows
are netted by default; aggregate = FALSE keeps their exact positions,
so arrows at identical times can overlap. No dates are jittered.
PV is a supplied annotation when present, not a recalculation or check.
Date origins and day counts differ from apv_life_flow() and are not
silently unified. The returned ggplot remains editable with additional layers.
This function uses compact actuarial notation: C denotes cash-flow amounts,
t denotes times in years, i denotes the interest-rate input, and PV
denotes present value.
See also
pv_flow, fv_flow, irr_flow, standardize_interest
Other time-value:
accumulation_factor(),
discount_factor(),
future_value(),
fv_flow(),
irr_flow(),
irr_flow_multi(),
present_value(),
pv_flow(),
solve_value()
Examples
plot_cash_flow(
C = c(-1000, 300, 400, 500),
t = c(0, 1, 2, 3),
i = 0.08,
currency = "$"
)
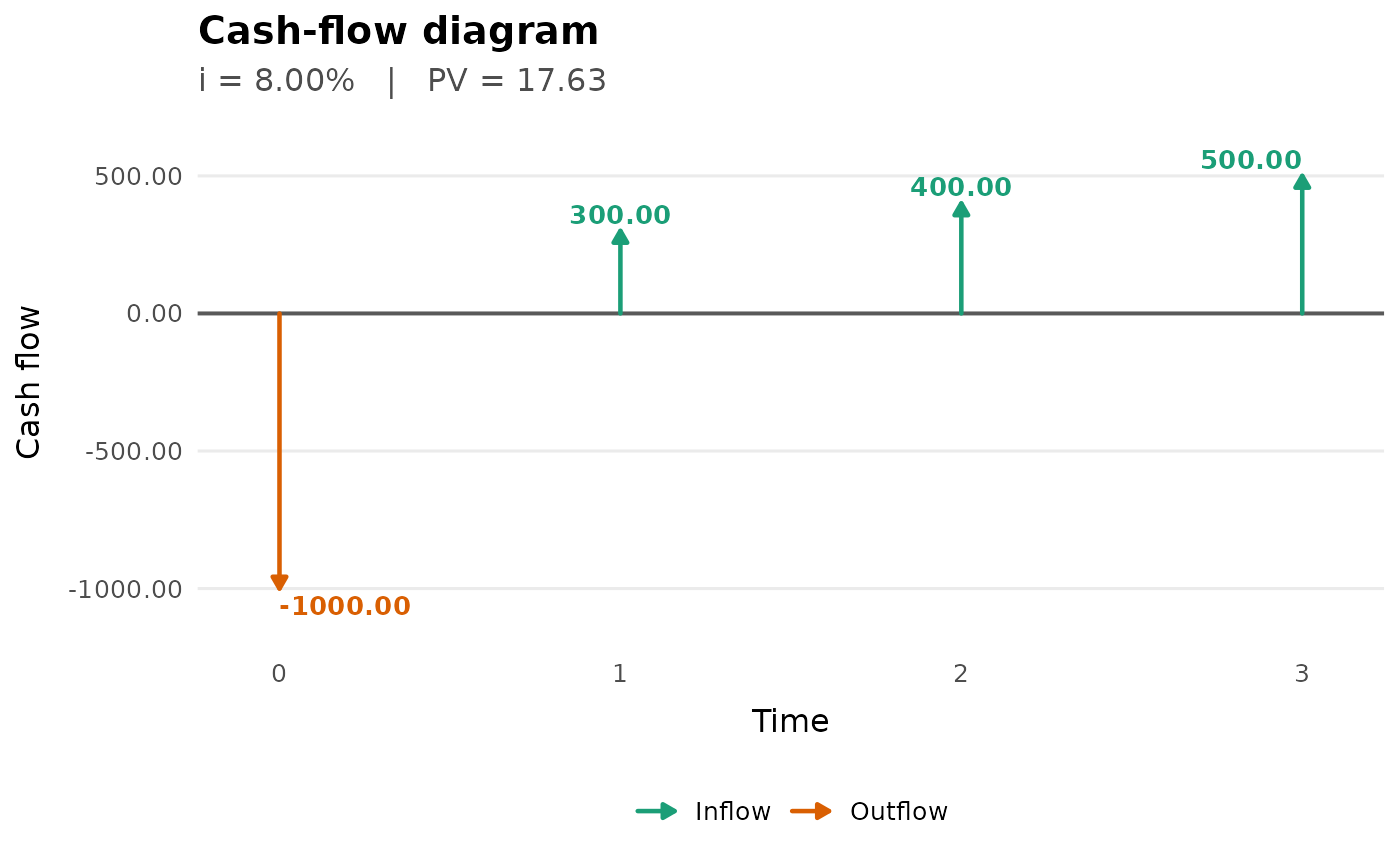
 cashflows <- tibble::tibble(
t = c(0, 1, 2, 3),
C = c(-1000, 300, 400, 500)
)
cashflows |>
plot_cash_flow(C = C, t = t, i = 0.08)
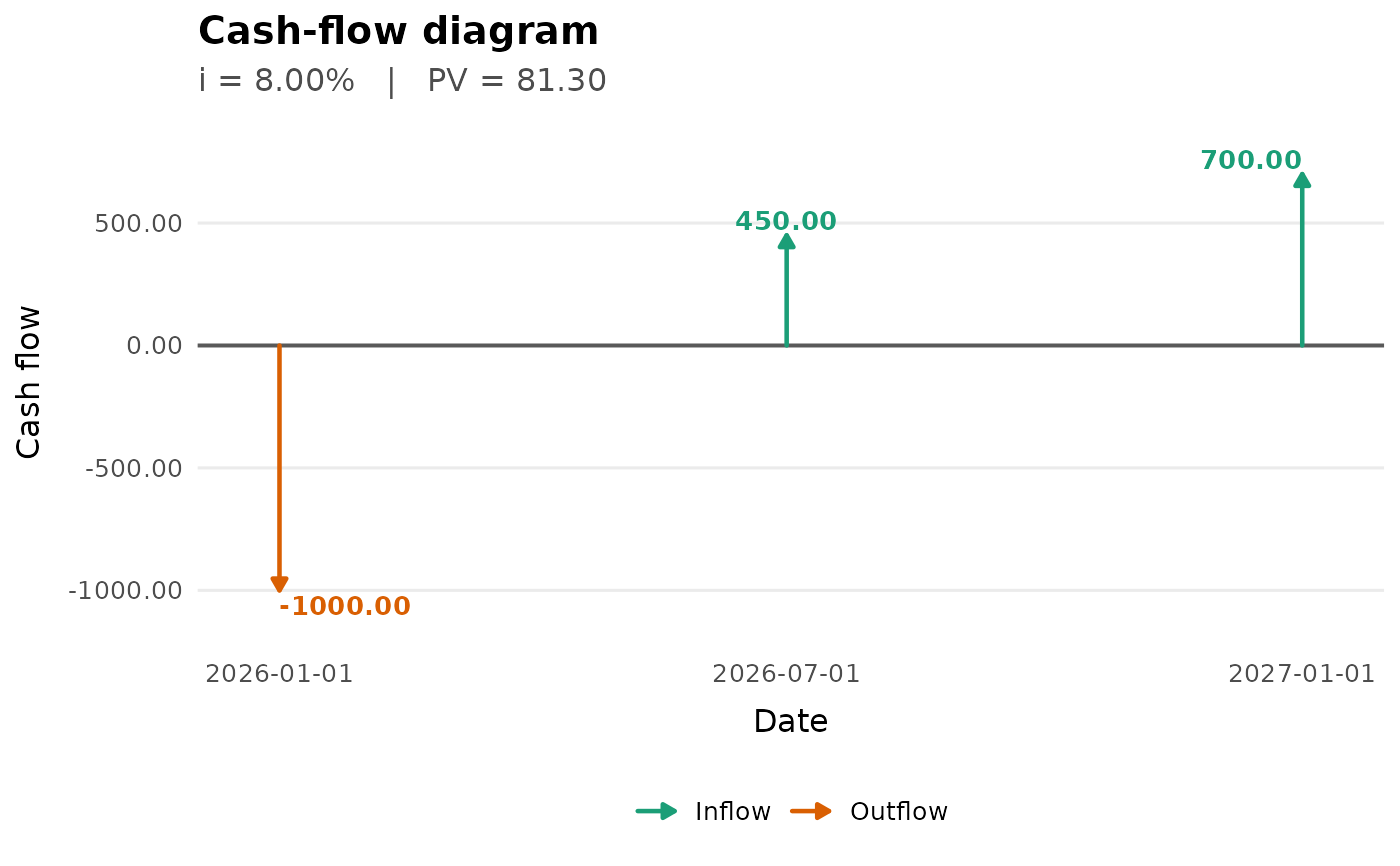
 dated_flows <- tibble::tibble(
date = as.Date(c("2026-01-01", "2026-07-01", "2027-01-01")),
C = c(-1000, 450, 700)
)
dated_flows |>
plot_cash_flow(C = C, date = date, i = 0.08)
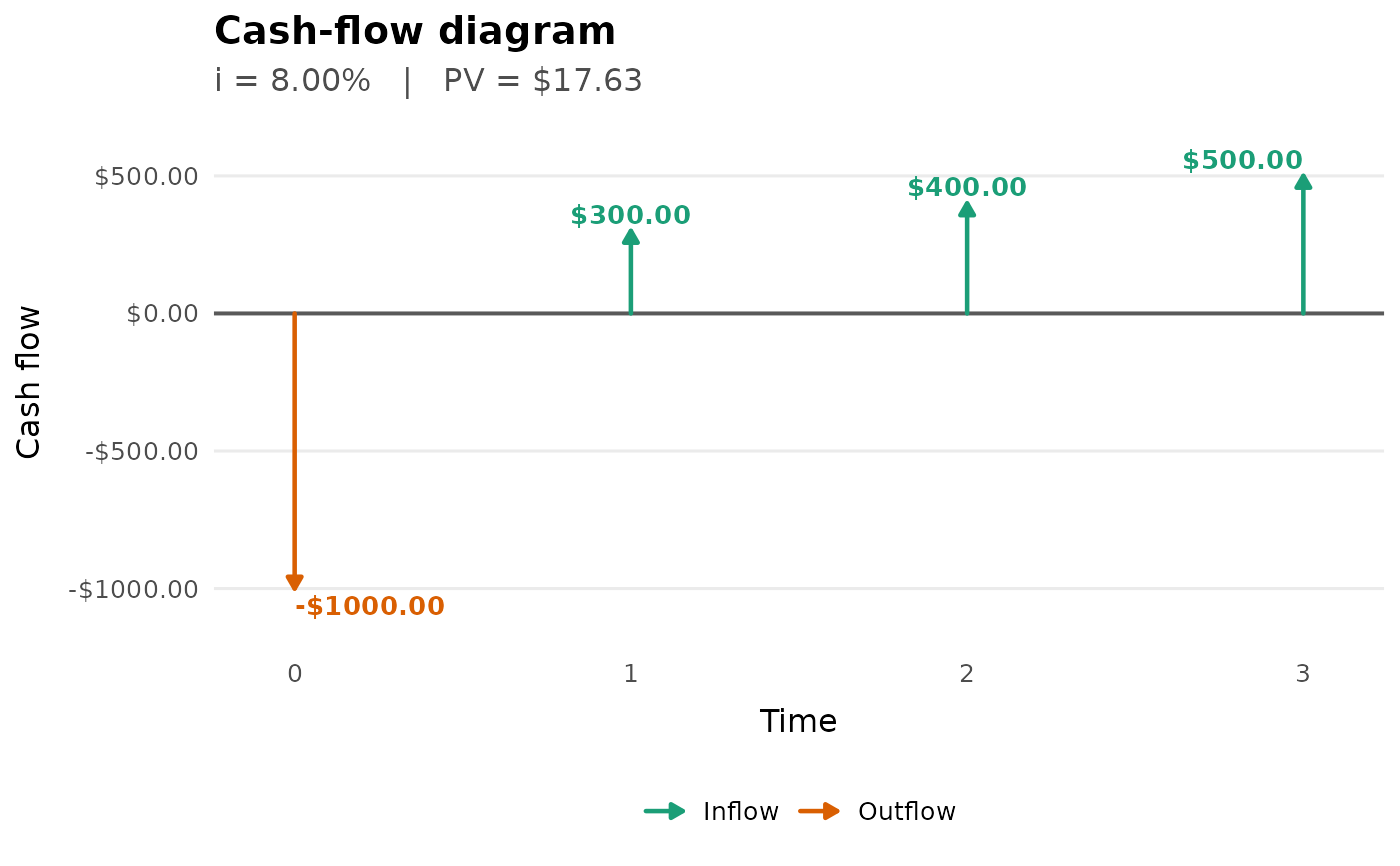
 plot_cash_flow(
payment = c(-1000, 300, 400, 500),
time = c(0, 1, 2, 3),
rate = 0.08,
currency = "$"
)