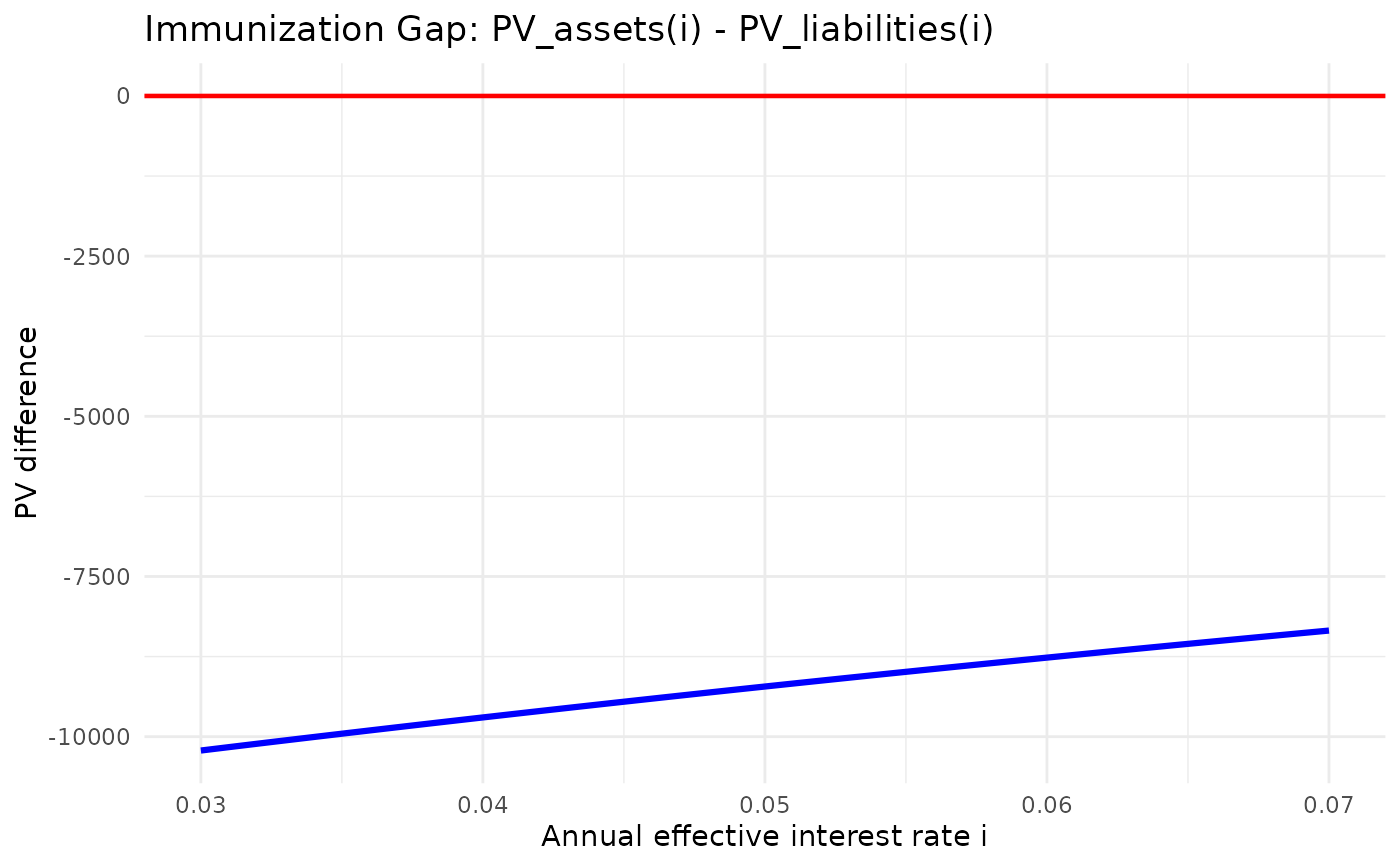
Plot immunization performance under interest-rate shifts
Source:R/plot_inmunization_gap.R
plot_immunization_gap.RdComputes and plots asset present value minus liability present value for an immunized portfolio under small interest rate changes. This allows visual evaluation of duration or duration-convexity immunization quality.
Usage
plot_immunization_gap(
  L,
  t,
  asset_cashflows,
  w,
  i,
  i_type = "effective",
  m = 1L,
  delta = 0.01,
  n_grid = 200L
)
Arguments
- L
Numeric vector of liability payments.
- t
Numeric vector of times of each liability payment.
- asset_cashflows
A list where each element is a list with components
$cfand$t, defining each asset's cash flow.- w
Numeric vector of portfolio weights or units. Must have the same length as
asset_cashflows.- i
Base interest-rate input.
- i_type
Character string indicating the interest-rate type. Allowed values are
"effective","nominal_interest","nominal_discount", and"force".- m
Positive integer. Conversion frequency for nominal rates. Ignored for
i_type = "effective"andi_type = "force".- delta
A numeric value defining the range of annual effective rates: from
i_effective - deltatoi_effective + delta, wherei_effectiveis the annual effective rate equivalent toi,i_type, andm.- n_grid
Number of rate values to evaluate. Integer from 2 through
.Machine$integer.max, with sufficient memory for the requested grid.
Value
A ggplot2 object showing the PV difference curve
\(PV_A(i) - PV_L(i)\) and a zero reference line.
Details
This function follows the compact actuarial notation used throughout
tidyactuarial: L denotes liabilities, t denotes payment
times, w denotes asset weights, cf denotes cash flows,
i denotes the interest-rate input, i_type denotes the
interest-rate type, and m denotes the conversion frequency for
nominal rates.
Let \(v(i) = 1/(1+i)\). For a liability stream \(L_k\) at time \(t_k\): $$PV_L(i) = \sum_k L_k \, v(i)^{t_k}$$
For a portfolio of assets with weights \(w_j\): $$PV_A(i) = \sum_j w_j \, PV_j(i)$$
The curve \(\Delta(i) = PV_A(i) - PV_L(i)\) illustrates immunization robustness. Under perfect duration immunization, this curve is tangent to zero at the base rate and non-negative nearby if the convexity condition is also met. The grid is expressed in annual effective yields and clipped, when needed, to the nearest representable value strictly above -1. Its base annual effective equivalent and grid endpoints must be finite and representable. Gap values combine signed weighted cash flows using log discounts, rather than subtracting separately overflowed portfolio values. Zero-weight assets contribute zero after validation. A nonfinite gap causes an explicit error. Recovery is limited by double precision and by cancellation already lost in input data; arbitrary extreme signed cancellation is not guaranteed. The graph reprices the supplied cash flows. Their consistency with the prices and sensitivities used to solve for weights remains the caller's responsibility. Matching convexity gives zero second derivative at the base yield and does not by itself ensure a positive surplus on either side.